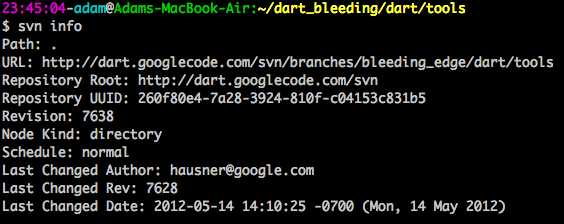
The debugger implementations are starting to land in bleeding_edge. This might all change by tomorrow, but for those of you who are tracking bleeding edge the following should get you running.
Choose a server side script you would like to debug, in this post will use chat-websocket-dart sample. Launch the dart vm with the –debug flag
The dart vm will now be waiting for incoming connections on 127.0.0.1:5858, the dart script state will be paused at the main entry point. ddbg.dart can be used to send debugging commands over the connection encoded as Json. Json has been selected as the format to be used for communications between the debugger client and dart vm debugger. From another shell, go into dart/tools and run ddbg.dart
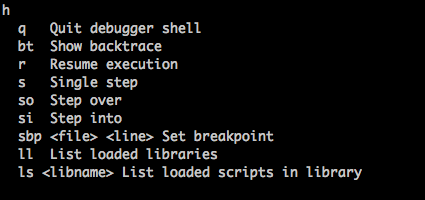
Currently the shell is very raw, so standard input is used for interacting with ddbg.dart. Following commands are currently available, hit ‘h’ to get the list of commands.
Putting a break point and resume execution in the following way.
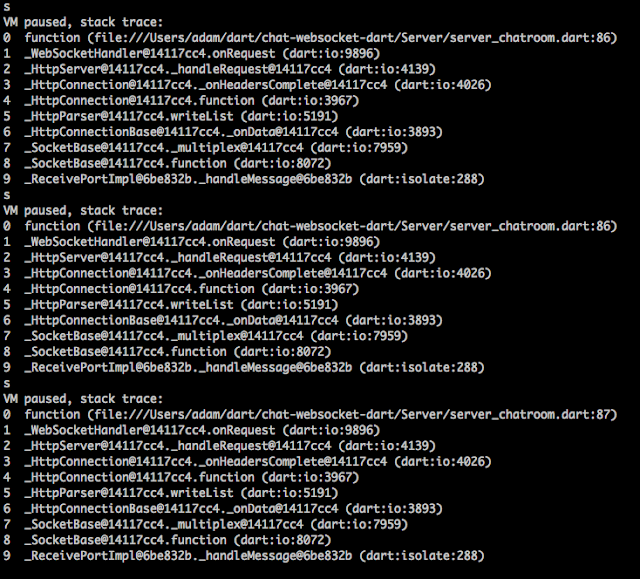
Taking a few steps we can see the line of execution change.
While all this is still raw at the moment, the direction of the debugger is starting to come along. I feel the quality of the debugger really matters for adoption, Visual Studio for me has been the leading edge of debugger UI and functionality. The amazing part of the current state of the dart vm debugger, it should be trivial for anyone to implement an interface to the dart vm debugger with Json.


